Published Edition of the alphaplot 1.02 , providing a graphical interface for analyzing and visualizing scientific data. Project development began in 2016 as fork scidavis 1.d009 , which, in turn, is a fork Qtiplot 0.9RC-2 . During the development process, a migration was made from the QWT library to QCustomPlot. The code is written in C ++, uses the Qt and license.
AlphaPlot seeks to be a tool for analyzing and graphical data representation. providing powerful mathematical processing and visualization (2D and 3D). There is support for various methods approximation to the specified points using curves. Results can be stored in raster and vector formats, such as PDF, SVG, PNG and TIFF. Supports the creation of scripts to build graphs in the JavaScript language. To expand functionality, the use of plugins is possible.
In the new version, an element control system on 2D graphs is improved, 3D-schedules navigation extended, added to save and load templates, a new dialogue with settings is proposed, and support for arbitrary filling, cloning, conservation and conservation templates and Print 3D graphs, vertical and horizontal panel grouping.

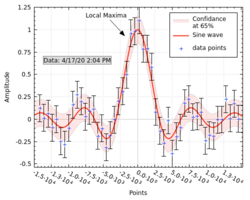
 *img src=”https://www.opennet.ru/opennews/pics_base/0_1642658935.png” Title = “” Border = “0”>