is presented a new version of the free monitoring system with a fully open source Zabbix 5.4 . The released release includes support for generating reports in PDF format, a new syntax for more complex problems detection aggregations, improved data visualization, token support for access to the API, tags at metrics, improve performance and much more.
Zabbix consists of Three basic components: Servers for coordinating checks, forming verification requests and accumulation of statistics; agents to carry out inspections on the side of external hosts; Frontand for organizing the system management. The code extends under the GPLV2 license. To remove the load from the central server and the formation of a distributed monitoring network, a series of proxy servers, aggregating data on the check of the host group, can be deployed. Data can be stored in MYSQL, PostgreSQL, TimeScaledb, DB2 and Oracle DBMS. Without agents, the Zabbix server can receive data on such protocols as SNMP, IPMI, JMX, SSH / Telnet, ODBC, test the availability of Web applications and virtualization systems.
basic innovations version 5.4 :
- Support PDF reports and their planned creation and sending to users, a new role to control access to this functionality
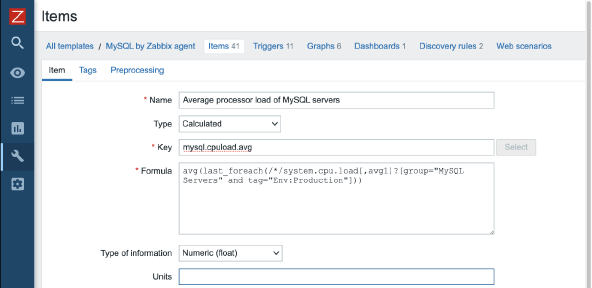
- fundamentally new syntax for trigger expressions, calculated and aggregate metrics. Got rid of all the well-known limitations of old syntax, but made it easier
- aggregate metrics are now able to select data on tags and stencils (wildcards) hosts and keys metric

- The functionality of the screenshots and dashborads is combined, the support of multi-page dashboards

- Support for named tokens to access the API, it is possible to specify the validity period of the token
- Support tags at metric. Applications are no longer supported

- performance improvements and accessibility
- for flights no longer need to connect to the database


